TL;DR
- Digital tools provide higher accuracy and safety than traditional hand-drawn jumping course diagrams.
- Scaled blueprints ensure distances match ESNZ standards, reducing the risk of unsafe related lines.
- Integrated software saves time for officials by syncing diagrams directly with rider apps and ring schedules.
In New Zealand, showjumping course design has evolved from pencil sketches on napkins to sophisticated digital blueprints that ensure safety and precision. Modern jumping course tools allow designers to calculate related distances accurately, manage tight ring spaces at local showgrounds, and produce professional diagrams that enhance the rider experience. By transitioning from hand-drawn sketches to digital platforms, organizers eliminate ambiguity and provide the 5-10% gain in efficiency needed to keep a busy jumping ring on schedule throughout a long competition day.
Why move away from hand-drawn jumping course diagrams?
For decades, the standard for a local ribbon day or a regional A&P show was a sheet of paper taped to a gate post with a marker-drawn path and numbered circles. While functional in a pinch, hand-drawn diagrams carry significant risks. The human eye is notoriously poor at judging the exact scale of a 50m x 80m arena on a standard A4 sheet of paper.
When a diagram is not to scale, the ground crew often finds themselves guessing if a vertical should stay a certain distance off the rail or move two meters in. This lead to field adjustments that can change the riding line entirely, potentially creating a distance that is unsafe or inconsistent across different fence heights. In our last few show seasons, we have seen that the most efficient kiwi shows are those that provide ground crews with exact measurements derived from a digital layout. This level of professionalism is one of the reasons why the best small horse shows are switching to free management software.
How does digital software improve jumping course design?
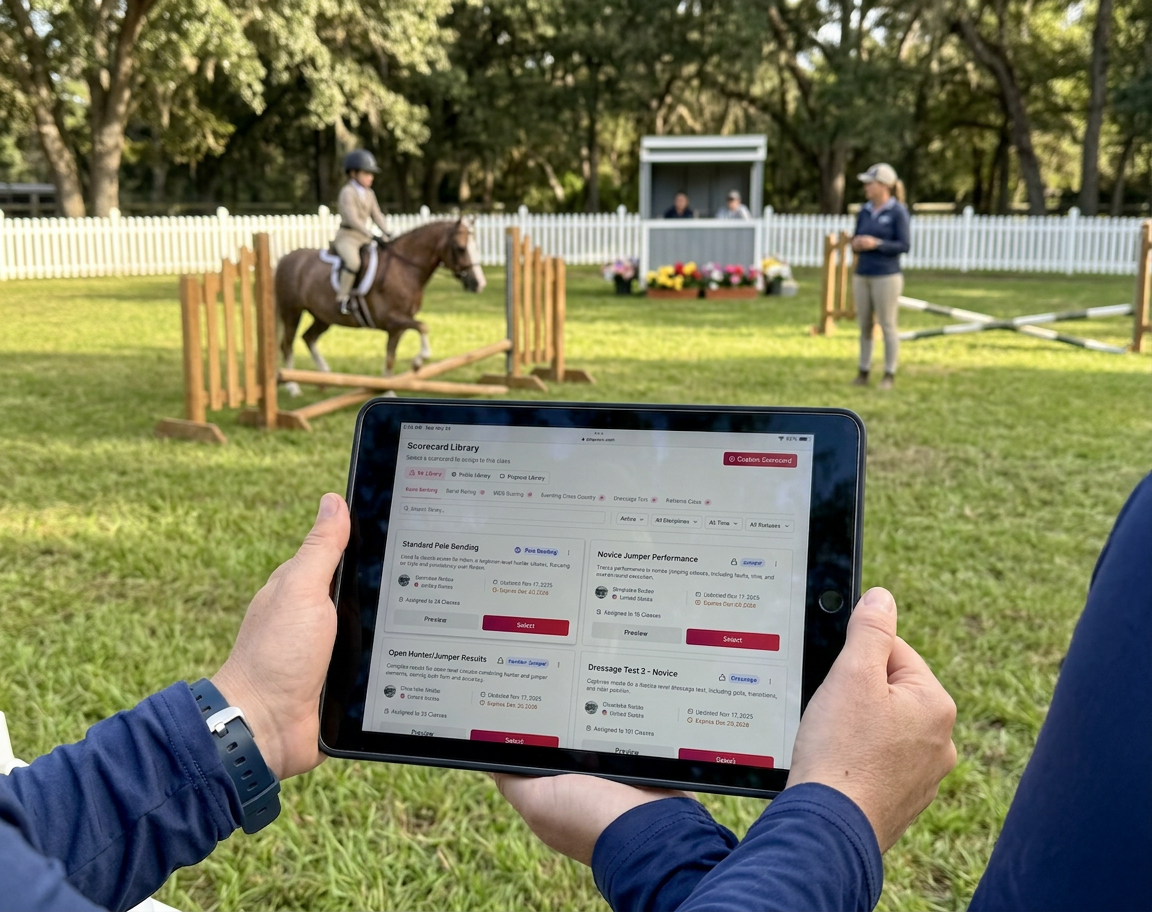
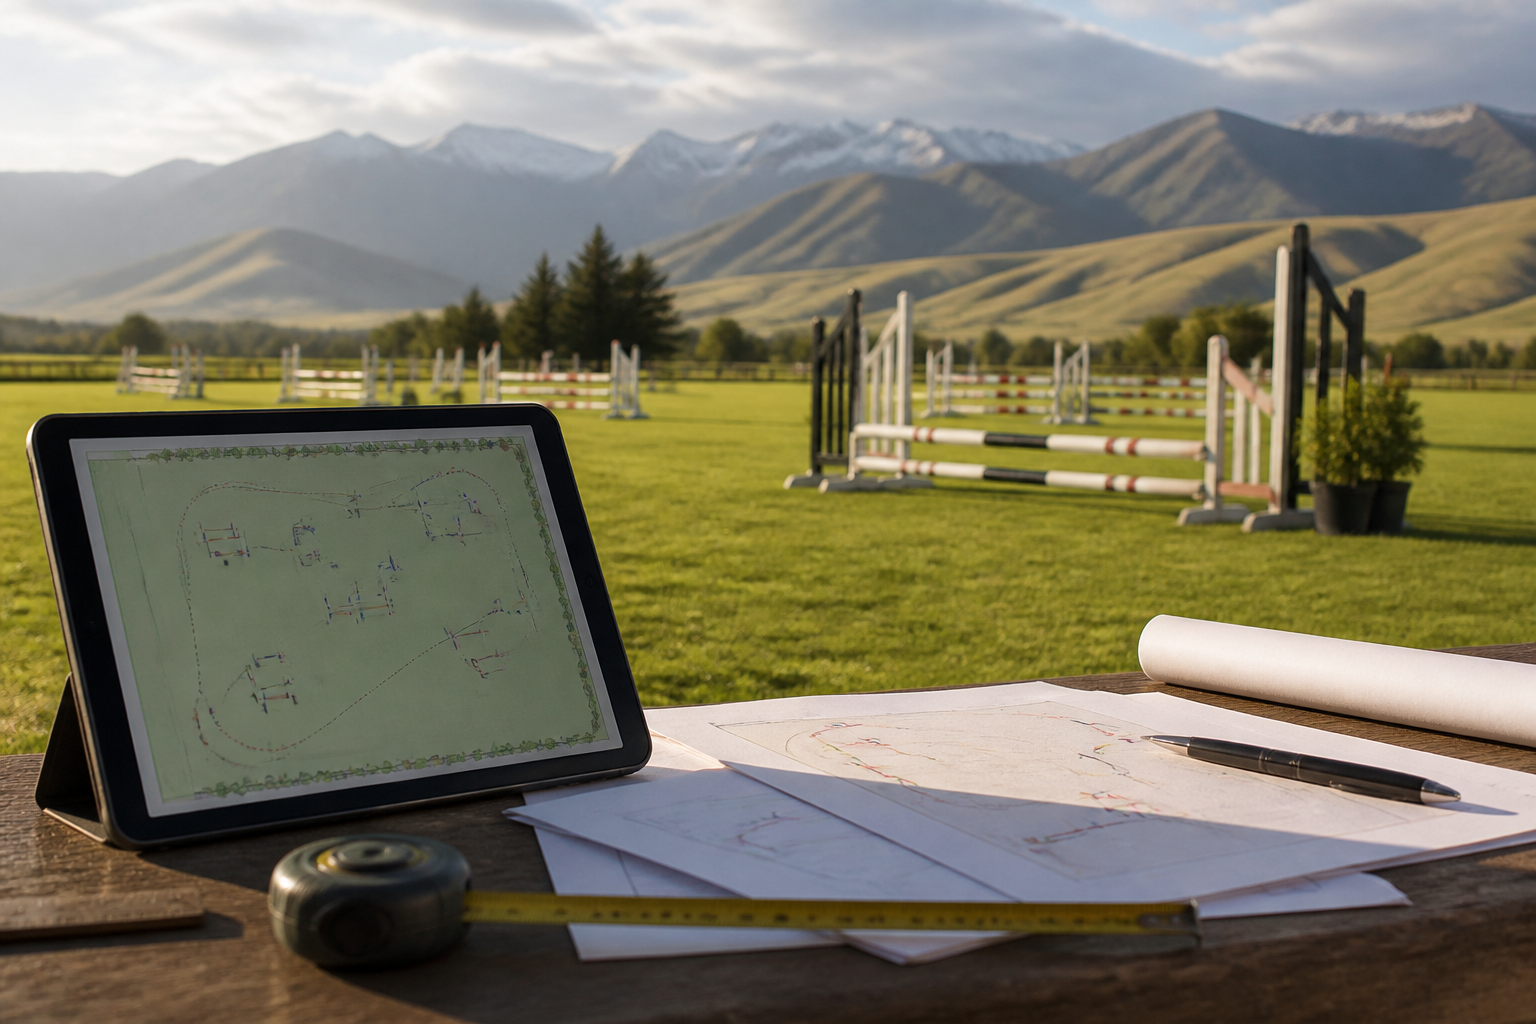
Digital tools offer a library of standardized symbols for oxers, verticals, walls, and combinations. Instead of drawing a messy rectangle, you drop a scaled object that represents the actual width and jumpable surface of the fence. This allows you to see exactly how much room you have for turnarounds and approach lanes in smaller arenas, which are common in many regional NZ venues.
Precise distance and metric measurements
One of the biggest advantages is the ability to lock in distances in meters. If you need a five-stride line for a hunter course, the software can calculate the ground poles to the fraction of a centimeter based on the arena's real dimensions. This is particularly vital for ESNZ jumping classes where the track length determines the time allowed. If your course map is inaccurate, your time allowed (calculated at 350-375 meters per minute for many classes) will be too, leading to frustration for riders and trainers.
Professionalism and rider communication
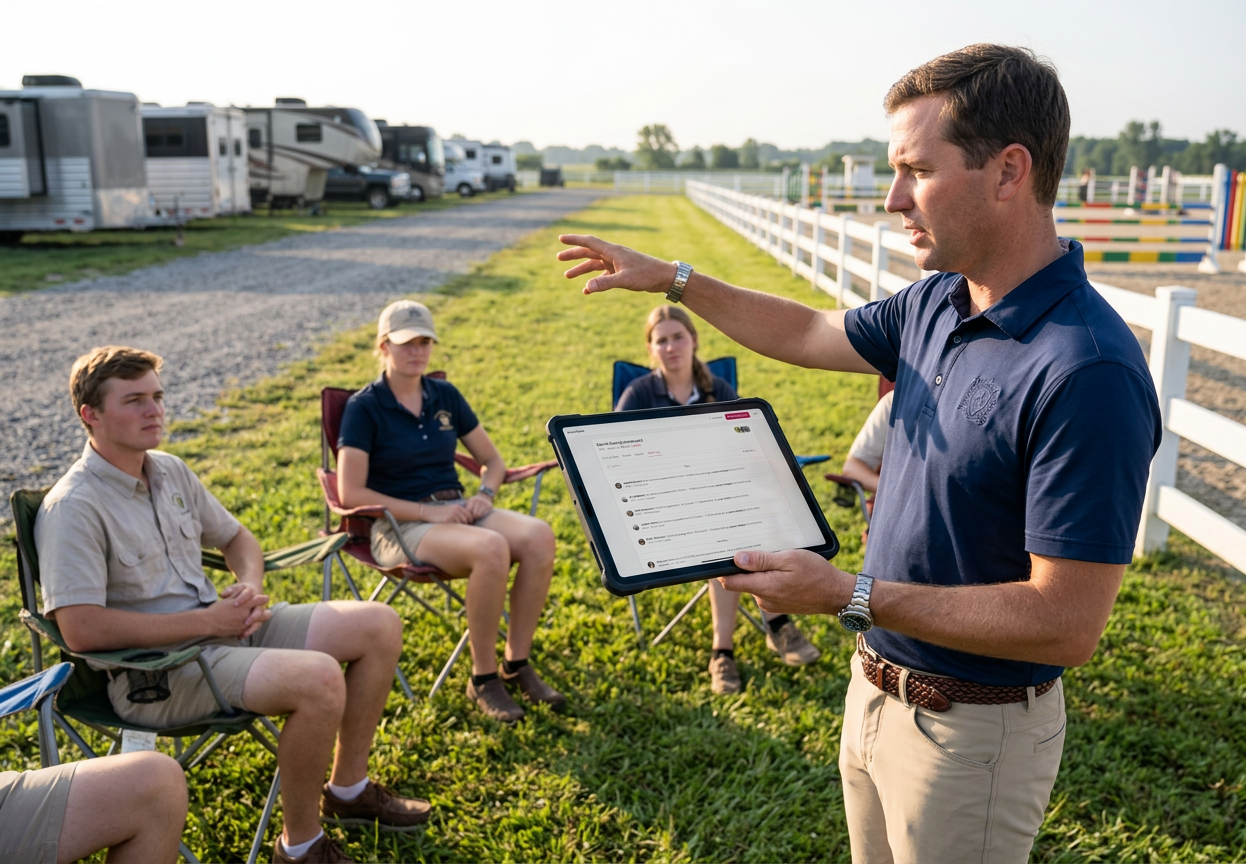
First impressions matter. When a rider walks up to the Show Hub or the ring gate and sees a clean, typed, scaled diagram, it builds confidence in the management. It signals that the show takes safety and technical standards (like those set by Equestrian Sports New Zealand) seriously. Digital files also share much more easily than a photo of a piece of paper. You can upload a PDF directly to Show Hub rooms, allowing trainers to study the course from the truck park without crowding the gate. This digital-first approach often results in a 20-30% reduction in gate-side congestion.
What are the benefits for show organizers?
At Pegasus, we realized that course design should not live in a separate silo from the rest of your show data. Most legacy tools require you to design in one program, save it as an image, and manually upload it elsewhere.
Our approach integrates the jumping course design directly into the class scheduling & ring management workflow. When you update a course for a specific section, that update can be pushed to the live scrolling results and the rider's mobile view instantly. This eliminates the frantic scramble to re-draw diagrams when the judge or designer decides to swap the order of the jumps five minutes before the first horse enters the ring. This level of synchronization is why we are often cited as the best software for running show jumping and hunter shows in NZ.
Integrated Pegasus features include:
- Scale-accurate arena templates: Input your specific ring dimensions once and design within those boundaries every time.
- Drag-and-drop elements: Quickly place standard obstacles, including timers and start/finish flags.
- Automatic track measuring: Get an instant read on the length of your track (in meters) to assist with time-allowed calculations.
- Mobile accessibility: Riders can view the course on their phones through the Pegasus platform, reducing the need for paper waste at the gate.
Is digital course design hard to learn?
A common concern among seasoned kiwi designers is the learning curve. Many are used to the tactile feel of a pencil. However, the easiest horse show software to use is designed with an intuitive interface that mimics the way a designer's mind works. If you can drag an icon on a tablet, you can design a course.
Using a digital tool actually saves hours over a weekend. If you use the same jump inventory for multiple shows throughout the 2024-2026 seasons, you can save your equipment list in the software. Instead of re-measuring every jump each month, you simply pull from your saved inventory. This is a game-changer for regional clubs because it allows for historical records of which courses were used in previous years, preventing repetition for your local riders.
How do digital tools enhance show safety?
Safety is the primary responsibility of any course designer. Digital tools help prevent accidents caused by traps-lines that look fine on paper but are physically impossible once the jumps are in the grass or sand. By visualizing the true track and the space required for landing and recovery, designers can ensure that there is always sufficient room between a combination and the arena wall.
Furthermore, having a digital record of the course used in every class provides an audit trail. If there is a fall or accident, the management can point to a scale-accurate diagram that proves the distances were regulation-compliant. This level of reporting is part of the full Pegasus feature overview designed to protect organizers and riders alike. We consistently see that shows using digital course maps report fewer disputes regarding time allowed or fence placement.
Final Thoughts on Modern Course Building
Moving to digital tools is not just about looking modern; it is about providing a fair, safe, and professional environment for the horses and athletes. Whether you are running a local Pony Club event or a multi-day Premier show, the precision of a digital jumping course far outweighs the convenience of a hand-drawn sketch.
By utilizing the tools within the Pegasus ecosystem, you can streamline your online entries & rider payments and match them with high-quality course presentation. The era of the marker pen and the crumpled piece of paper is ending; the era of the high-definition, mobile-compatible course map has arrived. If you are curious about the technical shift, we also recommend exploring cloud vs. desktop horse show software to see how web-based tools are changing the game in New Zealand.